Interhemispheric competition during sleep - Nature.com
Abstract
Our understanding of the functions and mechanisms of sleep remains incomplete, reflecting their increasingly evident complexity1,2,3. Likewise, studies of interhemispheric coordination during sleep4,5,6 are often hard to connect precisely to known sleep circuits and mechanisms. Here, by recording from the claustra of sleeping bearded dragons (Pogona vitticeps), we show that, although the onsets and offsets of Pogona rapid-eye-movement (REMP) and slow-wave sleep are coordinated bilaterally, these two sleep states differ markedly in their inter-claustral coordination. During slow-wave sleep, the claustra produce sharp-wave ripples independently of one another, showing no coordination. By contrast, during REMP sleep, the potentials produced by the two claustra are precisely coordinated in amplitude and time. These signals, however, are not synchronous: one side leads the other by about 20 ms, with the leading side switching typically once per REMP episode or in between successive episodes. The leading claustrum expresses the stronger activity, suggesting bilateral competition. This competition does not occur directly between the two claustra or telencephalic hemispheres. Rather, it occurs in the midbrain and depends on the integrity of a GABAergic (γ-aminobutyric-acid-producing) nucleus of the isthmic complex, which exists in all vertebrates and is known in birds to underlie bottom-up attention and gaze control. These results reveal that a winner-take-all-type competition exists between the two sides of the brain of Pogona, which originates in the midbrain and has precise consequences for claustrum activity and coordination during REMP sleep.
Main
In mammals, cortical electroencephalograms during sleep can be decomposed into rapid-eye-movement (REM) sleep, which is characterized by desynchronized electroencephalographic signals accompanied by rapid eye movements7,8,9, and non-REM (NREM) sleep, which is characterized by slow-wave activity (and hence is also called slow-wave (SW) sleep). In rodents and humans, NREM sleep has been implicated in the reactivation and consolidation of certain forms of memories10,11,12,13. The possible functions of REM, however, remain largely speculative (for example, unlearning14), although some evidence15,16,17 suggests a possible link with emotional memory. Biphasic sleep also exists in birds18, reptiles19,20,21 and fish22, suggesting the possibility of common roots (at least as old as the vertebrate lineage (500 million years)). (Biphasic sleep patterns have also been observed in some invertebrates23). If so, comparative approaches in systems that represent diverse animal lineages might help us to better understand not only the evolution of sleep, but also its functions and mechanistic underpinnings.
In Pogona vitticeps, a diurnal agamid lizard, the two phases of a regular electrophysiological sleep rhythm (as recorded in the dorsal-ventricular ridge or DVR) consist of local field potentials dominated by sharp-wave ripples that occur irregularly every 0.5–2 s for about a minute, followed by faster awake-like activity that co-occurs with rapid eye movements19, also for about a minute. These two activity modes alternate regularly throughout the night19. Because of the similarities between these two electrophysiological sleep phases and mammalian SW and REM sleep, we identify them as SW-like and REM-like (thereafter respectively named SW and REMP). (Note that our nomenclature is descriptive, and does not necessarily imply, for lack of knowledge at this point, functional or mechanistic identity with mammalian sleep states). The dominant features of SW activity in the DVR—the sharp-wave ripples—are produced in the claustrum, and are detectable in the adjacent DVR as a propagating wave21. Here we set out to examine the nature of REMP signals in Pogona, using electrophysiological recordings in vivo. Recording from the left and right claustra simultaneously, we observed differences in the nature of interhemispheric coordination between SW and REMP sleep. These differences, in turn, revealed an ongoing competition between the two hemispheres during REMP sleep—but not during SW sleep—and identified a role for a pair of midbrain pre-isthmic nuclei, which were until now not known to be involved in sleep.
Claustrum activity during REMP sleep
Recordings were made from the claustrum (mostly laterally) (Fig. 1a) or the adjacent anterior DVR, using silicon probes (Methods). During sleep, local field potential (LFP) activity alternated regularly between SW and REMP episodes (Fig. 1b, top), with each full sleep cycle lasting 1.5–2.5 min. SW sleep was characterized by the irregular generation of sharp-wave ripples, about once per second on average, as described previously19,21.
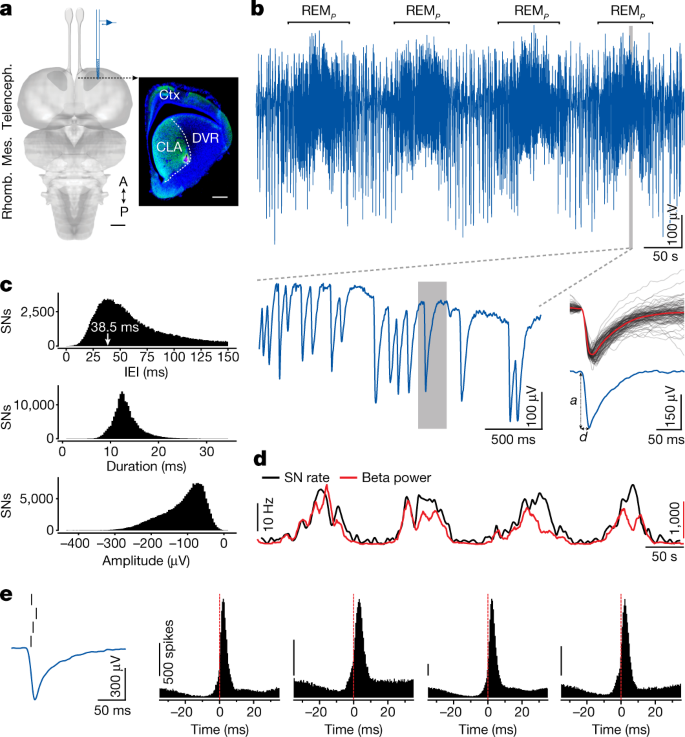
a, Dorsal view of the Pogona brain (Mes., mesencephalon; Rhomb., rhombencephalon; Telenceph., telencephalon; A, anterior; P, posterior), with recording site (CLA, claustrum). Inset, coronal section showing the claustrum (within dashed line; green fluorescence, hippocalcin) and the electrode tip position in red (DiI fluorescence). Ctx, cortex. Scale bars, 1 mm (left); 500 μm (right). b, Top, LFP recording from site in a, during around 8 min of sleep. Epochs between REMP episodes correspond to SW sleep, characterized by sharp-wave ripples21. Bottom left, expanded trace within shaded window at top (fourth REMP episode). Note the single sharp negative extracellular potential (SN), expanded on the right. Bottom right, blue: trace shaded on the left (a, amplitude and d, duration of falling phase; see c); grey: 100 superimposed SNs and their average (red). c, Statistics of IEI, duration (as in b) and amplitude across 190,578 SNs. IEI distribution truncated at 150 ms. d, Instantaneous rate of SN production superimposed on power in beta band (same epoch as in b). e, Extracellular SN potentials correspond to the production of phasic and synchronized firing in claustrum units. Left, SN and four sorted single units. Right, Histograms, distributions of spike times in the four units, relative to the time of peak |dV/dt| of the SNs (red line) (n = 100,632 events). Probability of these units producing at least one spike: 14–43%; probability of these units producing more than one spike: 0.3–3%. The small dip preceding the firing peak is likely to reflect the effects of down states that usually surround SNs, combined with those of the SN interval distribution during REMP. Calibration bars represent 500 spikes.
REMP activity in the claustrum consisted mainly of sharp downward (negative) extracellular potentials, occurring at irregular intervals (Fig. 1b, bottom left). Those events (which we call SNs, for sharp and negative) were quite consistent in shape but variable in both amplitude and inter-event interval (IEI; Fig. 1b, bottom). IEIs, time-to-trough and amplitude distributions over about 190,000 events are shown in Fig. 1c for one lizard (from 9 h of one night). The IEI distribution was skewed with a mode at about 40 ms (median: 60.2 ms; [25th, 75th] percentiles: [39.8, 110.5] ms). Previous results19,21 showed that REMP (in the DVR and claustrum) is dominated by LFP power in the 20-Hz (beta) band. The instantaneous power in the beta band (measured in a scrolling 10-s window) and the SN rate (Fig. 1d) were indeed well correlated, consistent with the mode of the IEI distribution. REMP activity in the claustrum is thus dominated by SNs and their interval statistics (3 animals, 9 nights; Extended Data Fig. 1a–d).
Single units isolated from claustrum recordings (Fig. 1e, left) typically fired 0–2 action potentials per SN, aligned to the SN's descending phase. Given the short duration of that phase, the action potentials of different units occurred within a few milliseconds of one another at most (Fig. 1e and Extended Data Fig. 1e). SN waveforms are therefore extracellular potentials that reflect a net-depolarizing current in claustrum neurons; this, in turn, probably underlies the synchronized firing of the depolarized units. We will show that this phasic field potential must result from input to the claustrum, and not solely from intrinsic and coordinated properties of claustral units themselves.
Bilateral coordination during sleep
We next recorded simultaneously from the left and the right claustra to examine the bilateral coordination of sleep-related activities. (Whereas a corpus callosum exists only in placental mammals, reptiles have several forebrain commissures24.) The regular cycling of SW and REMP was precisely synchronized across the two sides (Fig. 2a and Extended Data Fig. 2a), but the fine coordination of the two claustra differed greatly between the two phases. During SW, the sharp-wave ripples—characteristic of this phase—were not synchronized bilaterally, and their amplitudes did not covary (Fig. 2b and Extended Data Fig. 2b,c), consistent with the independent generation of sharp-wave ripples in each claustrum21 and the absence of reported contralateral projections between claustra in mammals25 and in Pogona21.
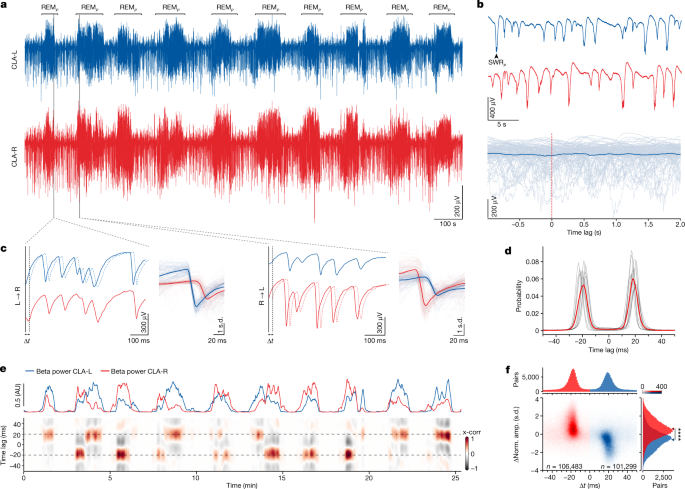
a, Paired recording from left (L, blue) and right (R, red) claustra, showing bilateral correspondence of REMP and SW episodes. b, Top, absence of coordination between sharp-wave ripples (SWRP, for Pogona SWR) in left and right claustra. Bottom, superimposed sweeps from one side (grey) and their average (blue), triggered from 100 single SWRPs from the other side (t = 0). c, Expanded epochs from a during two successive REMP episodes. Note the similarity between left and right traces and the small time-shift between them (filled versus dashed lines). Right, superimposed sweeps of one side triggered on the other (thin lines) and their average over 100 events (thick line). Note the very tight locking of the two traces. Note also that the leading side can switch from one sleep cycle to the next. d, Distributions of peak-correlation lags between left and right sides, showing two symmetric peaks at about ±20 ms (12 nights, 7 animals). Red, average. Data constructed over 9 h of sleep, containing 220,000–260,000 SNs per animal. e, Sliding cross-correlation (x-corr) between left and right traces (bottom) aligned with beta-band power on left and right sides. Positive lag, left side leads. Note that the side in which the beta power is larger leads, and that the leading side occasionally switches, even within the same REMP cycle. Epochs when the beta-band power is low correspond to SW. AU, arbitrary units. f, Differences between side-normalized amplitudes (Norm. amp.) of around 208,000 bilateral pairs of SNs versus the time lag between them (abscissa), and marginal distributions. Colour indicates leadership (lag sign). Note that SNs on the leading side have higher amplitudes than their contralateral partner. Mann–Whitney U-test, U = 2312573585.5, ****P = 0.0. Arrowheads indicate means.
During REMP, however, SNs in each claustrum were precisely mirrored (in timing and amplitude) on the opposite side and in sweeps from one claustrum triggered on SNs produced in the other (Fig. 2c). Over hundreds of thousands of SNs analysed, this tight correspondence between left and right sides was observed in 85 to 90% of the clearly detectable events (95–100 percentiles of SN amplitudes).
Although precisely coordinated, SNs from either side were not simultaneous, but offset by a delay of about 20 ms (median: 19.3 ms; [25th, 75th] percentiles: [15.4, 24.5] ms) with one side or the other leading (Fig. 2c). This delay was consistent throughout the night, across nights and across lizards (12 nights, 7 animals; Fig. 2d). SNs on both sides showed correlated amplitude variations (Fig. 2c), suggesting a common cause. The leading side would switch from one side to the other (Fig. 2c,d), but typically not on an event-by-event basis, as shown in a scrolling cross-correlation between left and right LFPs (Fig. 2e): switches occurred between REMP episodes (as here between the first and second), or once (occasionally twice) within single REMP episodes (as here during the second, fourth or sixth). The full sleep period from which this segment is shown is in Extended Data Fig. 3a.
The leading side at a given moment could usually be predicted by comparing the left- and right-claustrum LFPs: the side with dominant beta-band power tended to lead. In the second, fourth and sixth REMP episodes (Fig. 2e), for example, the crossing of the power curves corresponds to a leading-side switch. In the first and seventh, by contrast, one side dominated and led throughout. This correspondence between leadership and LFP power dominance was corroborated by an analysis of individual SN pairs: the SN with the larger amplitude generally led its contralateral counterpart (Fig. 2f).
The combination of matching bilateral pairs of waveforms, fixed positive or negative lags with the same absolute value and temporal lead of the stronger side suggested the possibility of competition between the two claustra, in which the stronger side at a given moment imposes its output on the weaker one, with a delay. By this hypothesis, leadership would depend on instantaneous variations of the relative 'strengths' of activity on the two sides, and the delay could be due to signal propagation and synaptic transfer in mirror-symmetric circuits. The suppression of the weaker side's own output—and its replacement by the stronger side's—suggested a winner-take-all type of bilateral competition.
Interhemispheric competition during REM
To understand the nature of this hypothetical competition, we examined the transitions between leading sides. Two successive REMP episodes are shown in Fig. 3a, together with three short segments of the left and right LFP traces from the second episode: in the blue frame, left power dominates and the SNs on the left lead; in the red frame, the converse happens; in the yellow frame, leadership is not settled. The yellow segment corresponds precisely to the time when the left and right beta-band powers are balanced (top traces).
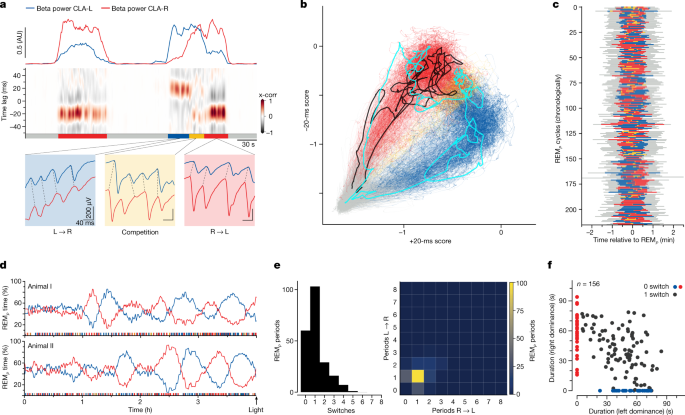
a, Detailed temporal relationship between left and right SNs during two REMP cycles. Blue shading, left leads. Red shading, right leads. Yellow shading, leading side not established; corresponds to time when beta-band powers are balanced (top traces). b, Dynamics of bilateral correlations plotted in a space defined by an instantaneous metric of temporal leadership (see Methods). Along x, left leads; along y, right leads. Each line represents one REMP cycle, starting from the grey area (−1.5, −1.5), which corresponds to SW sleep. Details in the main text. c, Plot of the fraction of time spent in each state (colours as in a,b) over 220 successive sleep cycles. d, Fraction of REMP time that each side spends leading in the four final hours of sleep (two animals). Note the long cycles, corresponding to many (more than ten) sleep cycles, of one-sided dominance tendency. e, Frequency distribution of leading-side switches per REMP episode. Left, distribution of total numbers of switches. Right, distribution of number of periods of dominance per REMP cycle. f, Duration of REMP episodes, separating those with one switch (black) from those with none (colours). When a REMP episode contains one switch, the mean total duration of the episode (value in x plus corresponding value in y for all black dots) approximates 90 s on average versus 60 s on average for episodes with no switch.
By scoring an instantaneous-leadership tendency of one side versus the other (Fig. 3b and Methods) and applying it to nine hours of sleep (around 208,000 SNs), we reveal high-density domains that correspond to identifiable states: in grey is SW, when the two sides are not correlated (see Fig. 2b); in red and blue are states in which one side leads the other (right or left, respectively); and in yellow is a state in which dominance switches ('competition'). The trajectory shown in black (Fig. 3b) corresponds to the first REMP episode in Fig. 3a; it remains on the red side from one SW state to the next. The cyan trajectory corresponds to the second REMP episode, in which dominance starts on the left side, enters the unsettled state (yellow) and finishes on the right side before moving back to SW. Over all recordings, the competitive (yellow) state was the least common of the three REMP states—for example, over one night's 210 REMP episodes, plotted in Fig. 3c, the average REMP episode consisted of 22 s with left dominating, 26 s with right dominating and 4 s as unsettled. When one side dominated, it tended to do so over many successive SNs. Thus, if the left and right sides do compete for dominance, they must do so with dynamics slower than individual SNs, suggesting that the drive causing left–right competition has different mechanisms than those that underlie the production of SNs.
The fraction of REMP time spent in each one of these three states (left dominating, right dominating or competition) is plotted for one night (Fig. 3c). This plot suggests that nearby REMP episodes are not entirely independent of one another; a temporal correlation exists such that the fraction of time that either side dominated waxed and waned throughout the night (Extended Data Fig. 4). Moreover, if one side led for the longest in a REMP cycle, it tended to do so over many successive sleep cycles (sometimes more than ten) in the last two to three hours of the night (Fig. 3d). This long-lasting side dominance at the end of the night thus indicates the existence of a slow competitive process between the two sides of the brain, on a timescale longer than that of the sleep cycle, and increasingly long as the night proceeds.
The great majority of REMP episodes contained either 0 or 1 dominance switch (Fig. 3e). REMP episodes with no switch lasted about 60 s (mean, 57 s; s.d., 16.6 s; n = 59), against 90 s (mean, 88.5 s; s.d., 19.6 s; n = 103) for those with one switch. In REMP episodes with one switch, the durations of each sub-period of dominance (left-dominant and right-dominant) self-adjusted such that the duration of the REMP period remained more or less constant (diagonal trend for black points, Fig. 3f).
A midbrain nucleus active during REMP
Guided by retrograde tracing from the claustrum, we searched for circuits that might underlie the left–right claustrum competition during REMP. We found no evidence for direct connections between the two claustra, and despite anatomical evidence for ipsi- and contralateral projections from the amygdala and cortex to the claustrum (Extended Data Fig. 5a,b), lesions in or ablation of either had no effect on the bilateral switching of REMP claustrum activities (Extended Data Fig. 5c–f). We next examined areas at the mid-to-hindbrain junction, given their known involvement in REMP control in mammals1,3,17. Recordings were obtained after traversing part of the optic tectum (green; Fig. 4a). We detected, from mesencephalic recording sites ventral to the caudal end of the optic tectum (Fig. 4b–e), REMP sleep activity that matched precisely activity recorded in the ipsilateral claustrum. These recordings were from a nucleus that contained large, sparsely distributed GABAergic (Vgat+) and parvalbumin-positive (Pvalb+) somata at the edge of the tegmentum, next to a tecto-thalamic fibre tract (Fig. 4b–d and Extended Data Fig. 6). We suggest that this is likely to be the homologue of the nucleus isthmi pars magnocellularis (Imc) in avians, in which it has been intensively studied26,27,28,29.
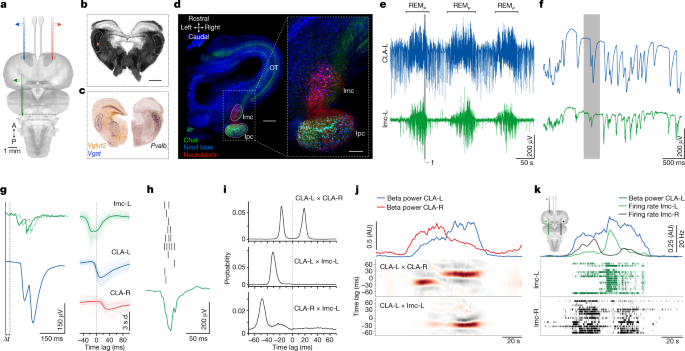
a, Position of three recording probes (Neuropixels): red and blue in the claustrum; green in the posterior midbrain. b, Transverse section at the posterior edge of the midbrain (dark-field image). The probe-tip position is visible in red (DiI fluorescence). Scale bar, 250 μm. c, Immunostaining of midbrain sections at levels corresponding to that in b. Note large-celled GABAergic (Vgat+) and Pvalb+ nucleus (Imc). d, Fluorescent Nissl stain (blue) of a horizontal section of the Pogona midbrain (only the right hemisphere is shown). Note the Imc and its cholinergic partner, the nucleus Ipc. A neurobiotin injection labelled large cell bodies characteristic of the Imc (red). OT, optic tectum. Scale bars, 500 μm (left); 200 μm (right). See also Extended Data Fig. 6. e, Recordings from ipsilateral claustrum (blue) and midbrain Imc (green) during three sleep cycles. Note the activity of the Imc during REMP. f, Magnification of a small section of the first REMP cycle in e (LFP filtered, 100 Hz). Note the very close correspondence of the two traces. g, Left, further magnification of a section of the grey shaded section of the record in f, revealing a time lag. Right, superimposed sweeps of ipsilateral Imc (green) and contralateral claustrum (red) triggered on 100 claustrum SNs (blue), and their averages (thick lines). h, Each Imc negative potential coincides with a short burst of spiking activity in Imc neurons. i, Distributions of peak-correlation lags between left and right claustra (top); between left claustrum and left Imc (middle); and between left claustrum and right Imc (bottom). j, Activity of the Imc during a REMP cycle is strongest when the ipsilateral claustrum leads. Middle, cross-correlation between left and right claustra. Bottom, cross-correlation between right claustrum and left Imc. k, Imc units on both sides of the midbrain show antagonistic activity during REMP. Left claustrum activity (beta power; blue) is strongest when the ipsilateral Imc is active (green).
Simultaneous recordings were made from both claustra (only the left shown) and the left Imc (Fig. 4e and Extended Data Fig. 7a–c). We noted a marked correspondence between the two (Fig. 4e–g); SNs characteristic of REMP in the claustrum aligned precisely with the Imc waveforms, which themselves corresponded to brisk firing bursts of Imc neurons (Fig. 4h). Imc field potentials led those in the claustrum by 30 ms ipsilaterally (median: −30 ms; [25th, 75th] percentiles: [−33.0, −27.0] ms) or 50 ms contralaterally (median: −45 ms; [25th, 75th] percentiles: [−51, −26] ms) (Fig. 4g,i and Extended Data Fig. 7b,c), a difference consistent with the 20 ms delay between the left and the right claustra (Fig. 2). This suggested that each claustrum receives excitatory synaptic drive coupled to Imc activity in the midbrain, and that the apparent competition between claustra (Figs. 2 and 3) might instead be the expression of bilateral competition in the midbrain.
Indeed, although the Imc was clearly active during REMP, its activity on a given side was strongest when the ipsilateral claustrum was also dominant (that is, phase-leading) (Fig. 4j). This suggested that the two Imcs compete with one another, and that claustrum dominance patterns reflect the results of Imc competition.
We recorded simultaneously from both Imcs (Fig. 4k and Extended Data Fig. 7d–j); sorted units from each side formed alternating bursts (two transitions in this REMP cycle; Fig. 4k; see also Extended Data Fig. 7g), the timing of which matched power changes in the claustrum. As predicted, the instantaneous power in the claustrum increased when the ipsilateral Imc was dominant. These results suggest that inter-claustral competition in fact results from bilateral competition within the midbrain, in which the Imc has a key role.
The Imc is required for bilateral competition
To test this hypothesis, we lesioned the Imc unilaterally using ibotenic acid (IBA) (Fig. 5a,b and Extended Data Fig. 8b) (n = 3 animals). The effects of these lesions were clear: the claustrum on the side of the lesioned Imc lost its ability to lead or dominate (Fig. 5c), and all REMP episodes were now dominated by the intact side, contralateral to the lesion, as seen in two hours of one night (Fig. 5c; see full 9 h in Extended Data Fig. 8a) and in the now unimodal claustrum phase-lag distributions (Fig. 5d) (3 animals, 8 nights). Correspondingly, the phase-leading claustrum (contralateral to the Imc lesions) was also the one with dominating beta power (blue; Extended Data Fig. 8a). Notably, lizards with unilateral Imc lesions also exhibited shorter REMP episodes (mean duration in control animals: 65 s, n = 12, versus 33 s in lesioned animals, n = 8; P = 0.000028, t = −6.992; Welch's two-sided t-test) and an excess of SW, resulting in less time spent in REMP sleep overall (mean REMP duration: 4:40 h over 9 h of sleep in control animals, versus 1:37 h over the same duration in lesioned animals; P = 0.000062, t = −7.204), suggesting that the Imc also has a role in the SW–REMP transition.
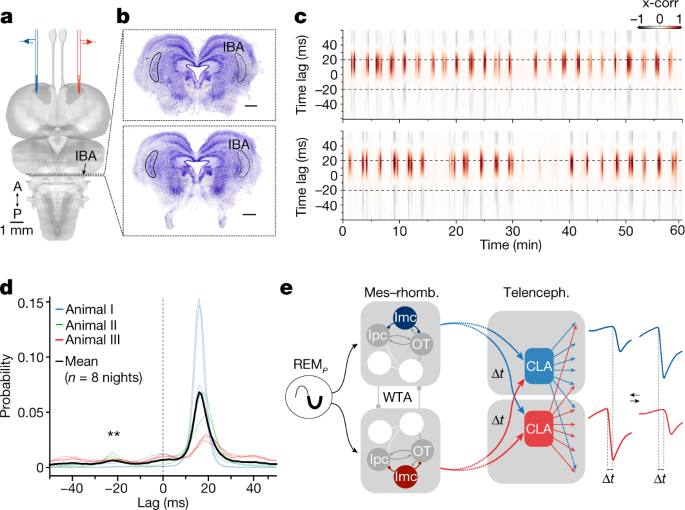
a, Claustrum recording sites (red and blue) and mesencephalic IBA injection site. b, Assessment of unilateral lesion after experiment (Nissl stain); only a few Imc neurons remain on the injected side. Scale bars, 500 μm. c, Two one-hour sleep segments in the lizard in b, plotting the cross-correlation of the left and right claustra. Note that only the claustrum on the side of the intact Imc leads. Full night recording in Extended Data Fig. 8. d, Distributions of peak-correlation lags between left and right (three operated animals, unilateral Imc lesion, eight nights, mean in black) showing unimodal distribution (compare with Fig. 2d). One-sided Wilcoxon signed-rank test, W = 36, **P = 0.00390625. e, Schematic of the proposed functional circuits that underlie the apparent inter-claustrum competition during REMP sleep. Mes–rhomb., mesencephalon–rhombencephalon; WTA, winner-take-all. Although the Imc is key to the left–right competition (a–d), it does not project to the other side of the midbrain, or to either claustrum in the forebrain. These projections and interactions thus rest on other relays, which have yet to be identified. The dashed lines between mid- and forebrains indicate the presence of putative relays (such as, possibly, the thalamic nucleus rotundus).
Discussion
We have described competitive dynamics between the two sides of the brain, which are detectable in the claustrum during REMP but not during SW sleep. Claustrum activity during REMP sleep consisted of very brief synchronized firing bursts coincident with sharp negative LFP events (SNs). Contrary to sharp-wave ripples during SW sleep, SNs were tightly correlated across the two claustra, with precise time delays and rapid switches of leadership correlated with reversals of amplitude dominance, suggesting a winner-take-all type of competition between the two claustra. This competition, however, did not have a telencephalic origin: the dominance of either claustrum required the integrity of the ipsilateral member of a bilateral pair of GABAergic mesencephalic nuclei (Imc). Hence, the apparent claustral competition during REMP sleep is the expression of competition in the midbrain, transferred bilaterally to the two claustra. The proposed functional circuits that underlie this relationship are schematized in Fig. 5e: in this model, the two sides of the midbrain compete during REMP, and side dominance depends on Imc integrity (Figs. 4 and 5). Each side of the midbrain projects to both claustra (possibly, but not necessarily or exclusively, via the thalamic nucleus rotundus30,31) such that, as one side dominates, left and right claustrum LFPs covary (owing to their common source) but with a time lag (owing to a longer decussating path). The smaller SN amplitude on the contralateral (lagging) side also suggests a lesser gain or reliability of the midline-crossing pathway. During the brief transitions when no midbrain side dominates, the left and right claustra are coactive, which results in disordered SN patterns in both claustra (Fig. 3a).
The Imc is part of a complex of cholinergic, glutamatergic and GABAergic isthmic nuclei that has been studied mainly in birds26,28,29,32 and is implicated in bottom-up attention and gaze control. The Imc, which is embryologically a pre-isthmic nucleus33, mediates a type of broad lateral inhibition of excitatory neurons in both the ipsilateral optic tectum and the nucleus isthmi pars parvocellularis (Ipc)—a companion cholinergic–glutamatergic nucleus that forms a positive feedback loop with the ipsilateral tectum27,29,31,32,34. When two stimuli fall onto one retina, these circuits undergo a winner-take-all-type competitive interaction such that responses to the stronger stimulus are selected, and attention and gaze are directed towards it, rather than to a weighted mean of the two stimuli. The Imc, by virtue of its heterotypic connectivity with the optic tectum and the Ipc, underlies this competition27,28. This work was at first concerned with the selection of competing visual stimuli falling on the same retina, but experiments have now established that competition also takes place between contralateral stimuli, and even between sensory modalities35, although the underlying circuits are not well understood. Likely homologues of these avian (reptilian) isthmic nuclei are found in fish36,37,38, amphibians39 and non-avian reptiles40,41, as well as in mammals (parabigeminal nucleus), in which a role in visual attention has been hypothesized42.
The isthmo–claustral connection uncovered here is notable in part because some of the claustrum's hypothesized functions are attentional43,44. But our results raise many new questions. First, what pathways underlie the bilateral mesencephalic competition (Fig. 5e)? Although the Imc is inhibitory (Fig. 4c) and necessary for this competition (Fig. 5), we are not aware of contralateral Imc projections. Second, what pathways link Imc, a GABAergic nucleus, to the activation of both claustra? The high correlation between isthmic and claustral LFPs during REMP suggests high-gain excitatory pathways between those areas, or drive from a common source, the dominance of which depends on the integrity of the ipsilateral Imc. Third, what is the functional importance of the tight correlation and ±20-ms delays between the claustra during REMP? Although there is no evidence for direct projections between the claustra, bilateral claustral projections to the telencephalon exist25,44, such that convergence on common targets is plausible. If so, the delays might, in conjunction with the activation of spike-timing-dependent plasticity rules, have a role in synaptic homeostasis16,45,46 or plasticity during REMP. These hypotheses are especially intriguing when considering that the temporal profiles of dominance are different early and late in the night (Fig. 3), and that sharp-wave ripples are uncorrelated bilaterally during SW (Fig. 2 and Extended Data Fig. 2). Fourth, several species of birds and marine mammals show unilateral sleep47,48. Could the same mesencephalic circuits underlie this (slower) alternation? Fifth, side dominance is temporary and balanced between the two sides over each night. What is the cause of the recurrent transfer of side dominance (Fig. 3), presumably located upstream of the Imc? Because the duration of one-sided dominance varies between a fraction of one sleep cycle and many cycles, it probably does not originate in the circuits that cause SW–REMP alternation. Sixth, what role does the isthmic complex have in SW–REMP transitions? Imc lesions revealed a decrease in REMP and a concurrent increase in SW sleep, indicating an interaction with circuits that control the ultradian sleep cycle. Finally, how are activities between the isthmi and the claustra coordinated in the awake state, given that brain activity during REMP sleep most resembles that in the awake state9,17?
Hence, the claustrum—a well-described44,49 but functionally poorly understood area of the telencephalon—seems to have a role in SW sleep in reptiles and mammals21,50, and reflects competitive brain dynamics during REMP sleep (this paper), with origins in the midbrain. Antiphase activity between the two hemispheres has been identified in running rodents and during REM with fast rhythms (140-Hz 'splines') in superficial retrosplenial cortex6, but the mechanisms that underlie this relationship are unknown. The relative simplicity of the reptilian model may thus help to reveal not only some mechanisms of sleep, but also some of the functions of the claustrum and of the midbrain in sleep.
Finally, our data emphasize the value of investigating non-mammalian sleep. Comparing stages of sleep (for example, SW and REM), electrophysiological waveforms (for example, SWRs) or even brain areas (for example, the claustrum) across distant species can be difficult; indeed, the terminology of sleep originated with data from humans and cats, the phenomena to be compared are usually multiparametric and sleep is polymorphic even among mammals. Matches across species are thus often only partial. But by comparing data using exhaustive and increasingly precise approaches, hypotheses about structural homologies can now be tested more accurately, at least among vertebrates. This should in turn help us to determine which phenotypic and mechanistic attributes of sleep are common across species, how they came to diverge or converge, and eventually whether they subserve similar functions.
Methods
Animals
Lizards (P. vitticeps) of either sex, weighing 150–250 g, were obtained from our institute colony and selected for size, weight and health status. The lizards were housed in our state-of-the-art animal facility. All experimental procedures were approved by the relevant animal welfare authority (Regierungspräsidium Darmstadt, Germany) and conducted following the strict federal guidelines for the use and care of laboratory animals (permit numbers V54-19c20/15-F126/1005_1011 and 2006).
Lizard surgery for chronic recordings
Twenty-four hours before surgery, lizards were administered analgesics (butorphanol, 0.5 mg kg−1 subcutaneously; meloxicam, 0.2 mg kg−1 subcutaneously) and antibiotics (marbofloxacin, marbocyl, 2 mg kg−1). On the day of surgery, anaesthesia was initiated with 5% isoflurane, and maintained with isoflurane (1–4 vol%) after intubation. The lizards were placed in a stereotactic apparatus after ensuring deep anaesthesia (absence of corneal reflex). Body temperature during surgery was maintained at 30 °C using a heating pad and an oesophageal temperature probe. Heart rate was continuously monitored using a Doppler flow detector. The skin covering the skull was disinfected using 10% povidone-iodine solution (Betai-NE) before removal with a scalpel. A cranial window was made to reach the various regions of interest; the dura and arachnoid were then removed with fine forceps and scissors. The pia was carefully removed over the area of electrode insertion (dorsal cortex for claustrum and optic tectum for Imc recordings). The exposed skull was covered with a layer of ultraviolet (UV)-hardening glue, and the stripped ends of insulated stainless steel wires were secured in place subdurally with UV-hardening glue, to serve as reference and ground.
Silicon probes were mounted on a Nanodrive (Cambridge Neurotech) and secured to a stereotactic adaptor for insertion. On the day after the surgery, probes were slowly lowered into the tissue (claustrum: 0.8–1.2 mm; Imc: 2.5–3.0 mm). For Imc recordings, the probe was advanced in small steps over two to three days until the signal began to show the area-typical signature.
The brain was covered with Duragel (Cambridge Neurotech) followed by Vaseline, and the probes were secured with UV-hardening glue. After surgery, lizards were released from the stereotactic apparatus and left on a heating pad set to 30 °C until full recovery from anaesthesia.
In vivo electrophysiology
Two to three days before surgery, lizards were habituated to a sleep arena, which was itself placed in a 3 × 3 × 3-m electromagnetic-shielded room. One hour before lights off (toff = 18:00/19:00, winter/summer), lizards were placed into the arena and left to sleep and behave naturally overnight. They were returned to their home terrarium 3 to 4 hours after lights on (ton = 06:00/07:00, winter/summer). The lizards then received food and water. Experiments were performed at a constant room temperature of around 21.5 °C.
Electrodes were either 32-channel silicon probes (NeuroNexus; 50-μm pitch, 177-μm2 surface area for each site; in 2 rows of 16 contacts), or Neuropixels 1.0 probes51. Recordings using 32-channel probes were performed with a Cheetah Digital Lynx SX system and HS-36 headstages as previously described21. Signals were sampled at 32 kHz, and IronClust with manual curation was used for spike sorting (https://github.com/flatironinstitute/ironclust#readme). Neuropixels data were acquired nominally at 30 kHz using SpikeGLX software (http://billkarsh.github.io/SpikeGLX/). The true sampling frequency varied slightly with different headstages and could drift throughout a recording. Data acquired from multiple probes were synchronized by linear interpolation, using as a reference a common 1-Hz squarewave signal recorded with all probes.
Action potentials were sorted using Kilosort2 (ref. 52; https://github.com/MouseLand/Kilosort) and the ecephys pipeline (https://github.com/jenniferColonell/ecephys_spike_sorting); clusters were curated manually in Phy (https://github.com/cortex-lab/phy).
Lesion experiments
In preparation for Imc lesion experiments, we carefully removed the pia overlaying the optic tectum and inserted a bevelled quartz micropipette at an angle of 6–8° from the vertical axis to depths of 2,700–2,900 μm. IBA (200–350 nl; 10 μg μl...


Comments
Post a Comment